Data Compliance % = How compliant your data is against the requirements set by Blueprints.
To keep things simple, let’s say we have four records that we are going to audit against a blueprint that includes six different data quality rules to check.
For Record A, the audit finds two critical issues, one minor issue, one info message, and two of the rules returned compliant results. These results are called audit messages. Data compliance per record is calculated as a percentage of compliant messages out of all the messages while ignoring the info messages. For Record A, the data compliance percentage is 40.
Record B has one more issue, so the compliance percentage is only 20 (1 compliant / 5 in total). Records C is almost fully compliant with the blueprint having only one minor issue; therefore, it is 80 percent compliant. Record D has no issues, so it’s 100 percent compliant with the blueprint.
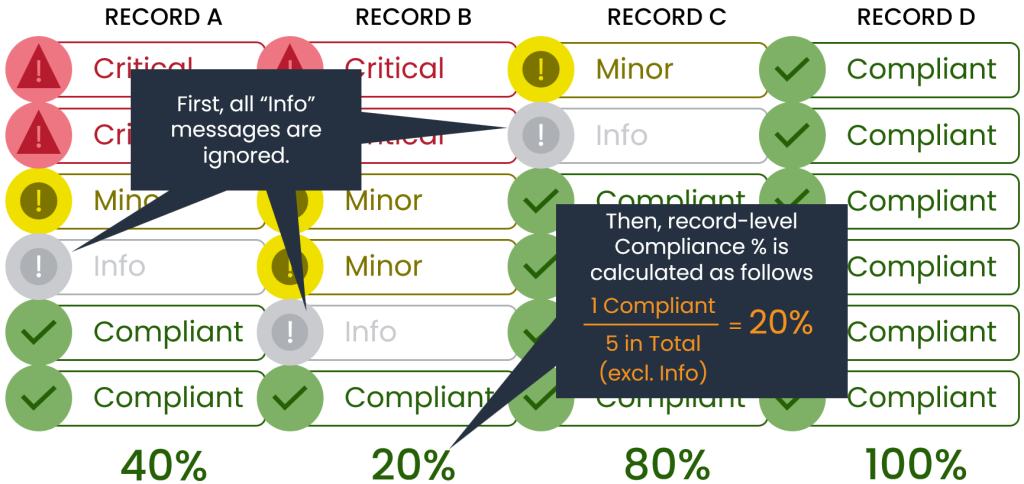
When we add all these numbers up, we get an average compliance percentage of 60 for this audit.
What has changed (in DCM R6.1)
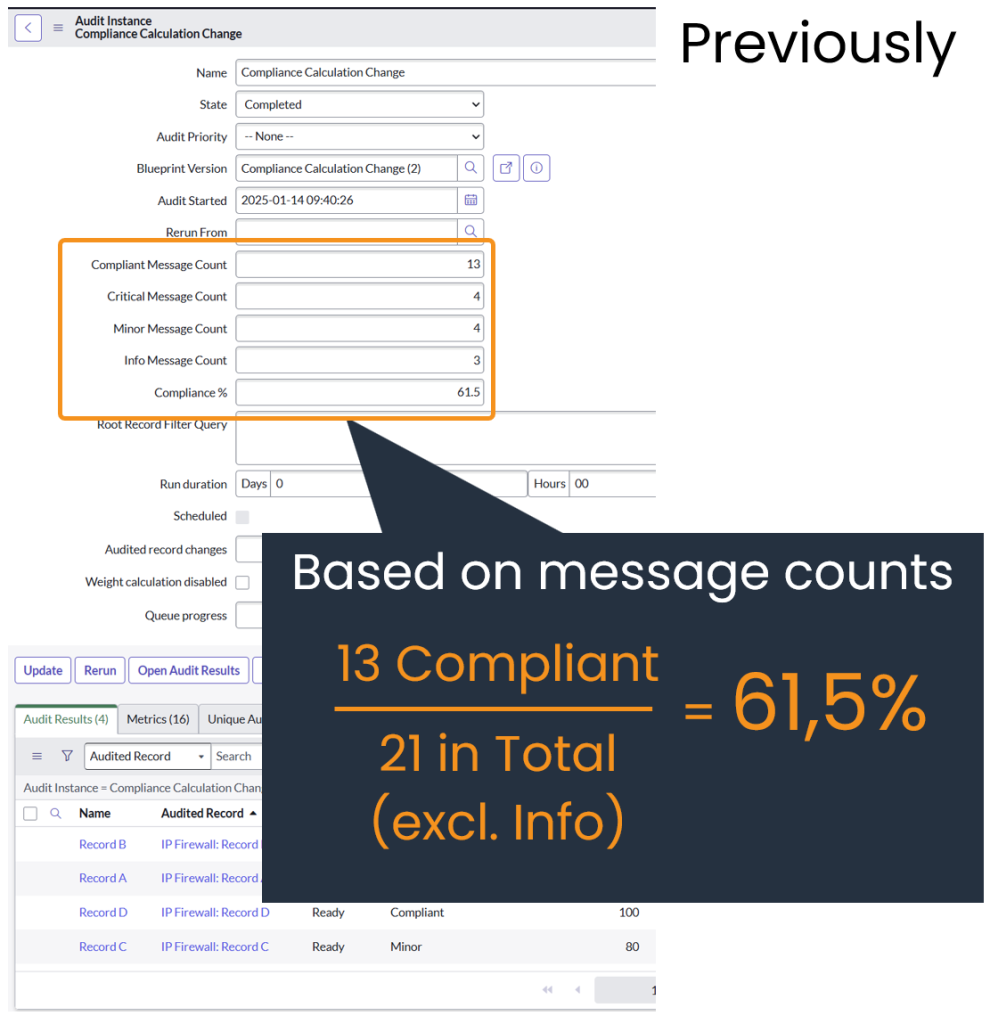
Previously, on the Audit Overview Dashboard, the overall Compliance % was calculated directly based on the number of compliant audit messages divided by the total number of audit messages (excl. info messages).
On My Data Domains Dashboard, the Compliance % and the matching trend is calculating the Compliance % as an average of the Audit Result’s Compliance percentages. Meaning, the average compliance % of every audited record in that audit run.
These two different ways to calculate the Compliance % have caused confusion since these percentages do not always match.
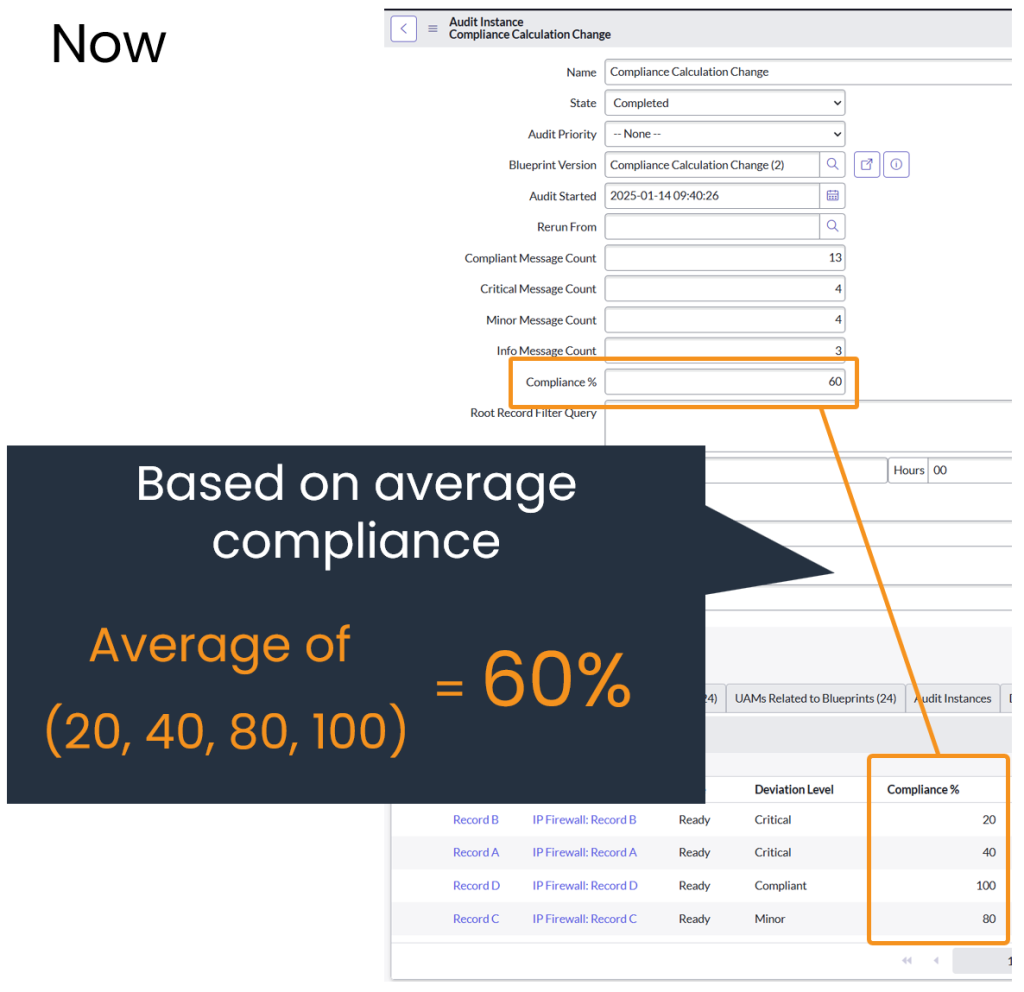
Now (since DCM R6.1) the overall compliance % is also calculated as an average of audit result compliance percentages. Not, based on total audit message counts for the audit run.
On the Audit Overview Dashboard, the compliance reports are based on Audit Instance data. Below we show two examples on how the Compliance % was calculated before the change, and how it’s calculated from now on.
Previously: Compliance % = Compliant Message Count / Total Message Count (excl. Info).
Now: Compliance % = Average of Audit Result Compliance percentages for the audit.
Depending on the blueprints and audited data, this change can increase or decrease your overall compliance % on the Audit Overview Dashboard. Reports and results on the My Data Domains and My Data Quality Dashboards and the Data Quality Workspace will remain the same. Those have already used the “new way” for calculations.
What do you need to do?
Nothing, if you don’t want to update historical compliance percentages or you have started to use DCM after the 6.1 version.
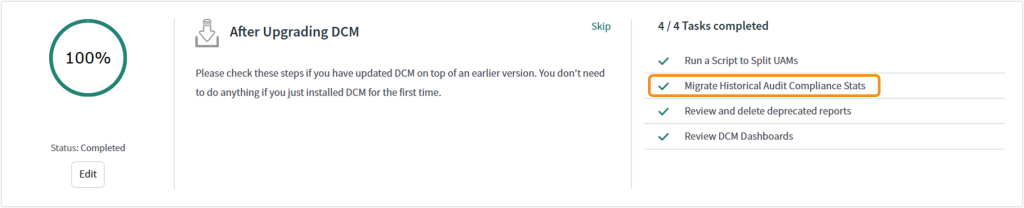
But if you want to update previous audit instances (created with DCM version prior to 6.1) to use the current compliance % calculation, then you can run a scheduled job, that updates historical data for a selected time frame. This is instructed in the DCM Guided Setup under “After Upgrading DCM” section.